About GitHub Repo Stats
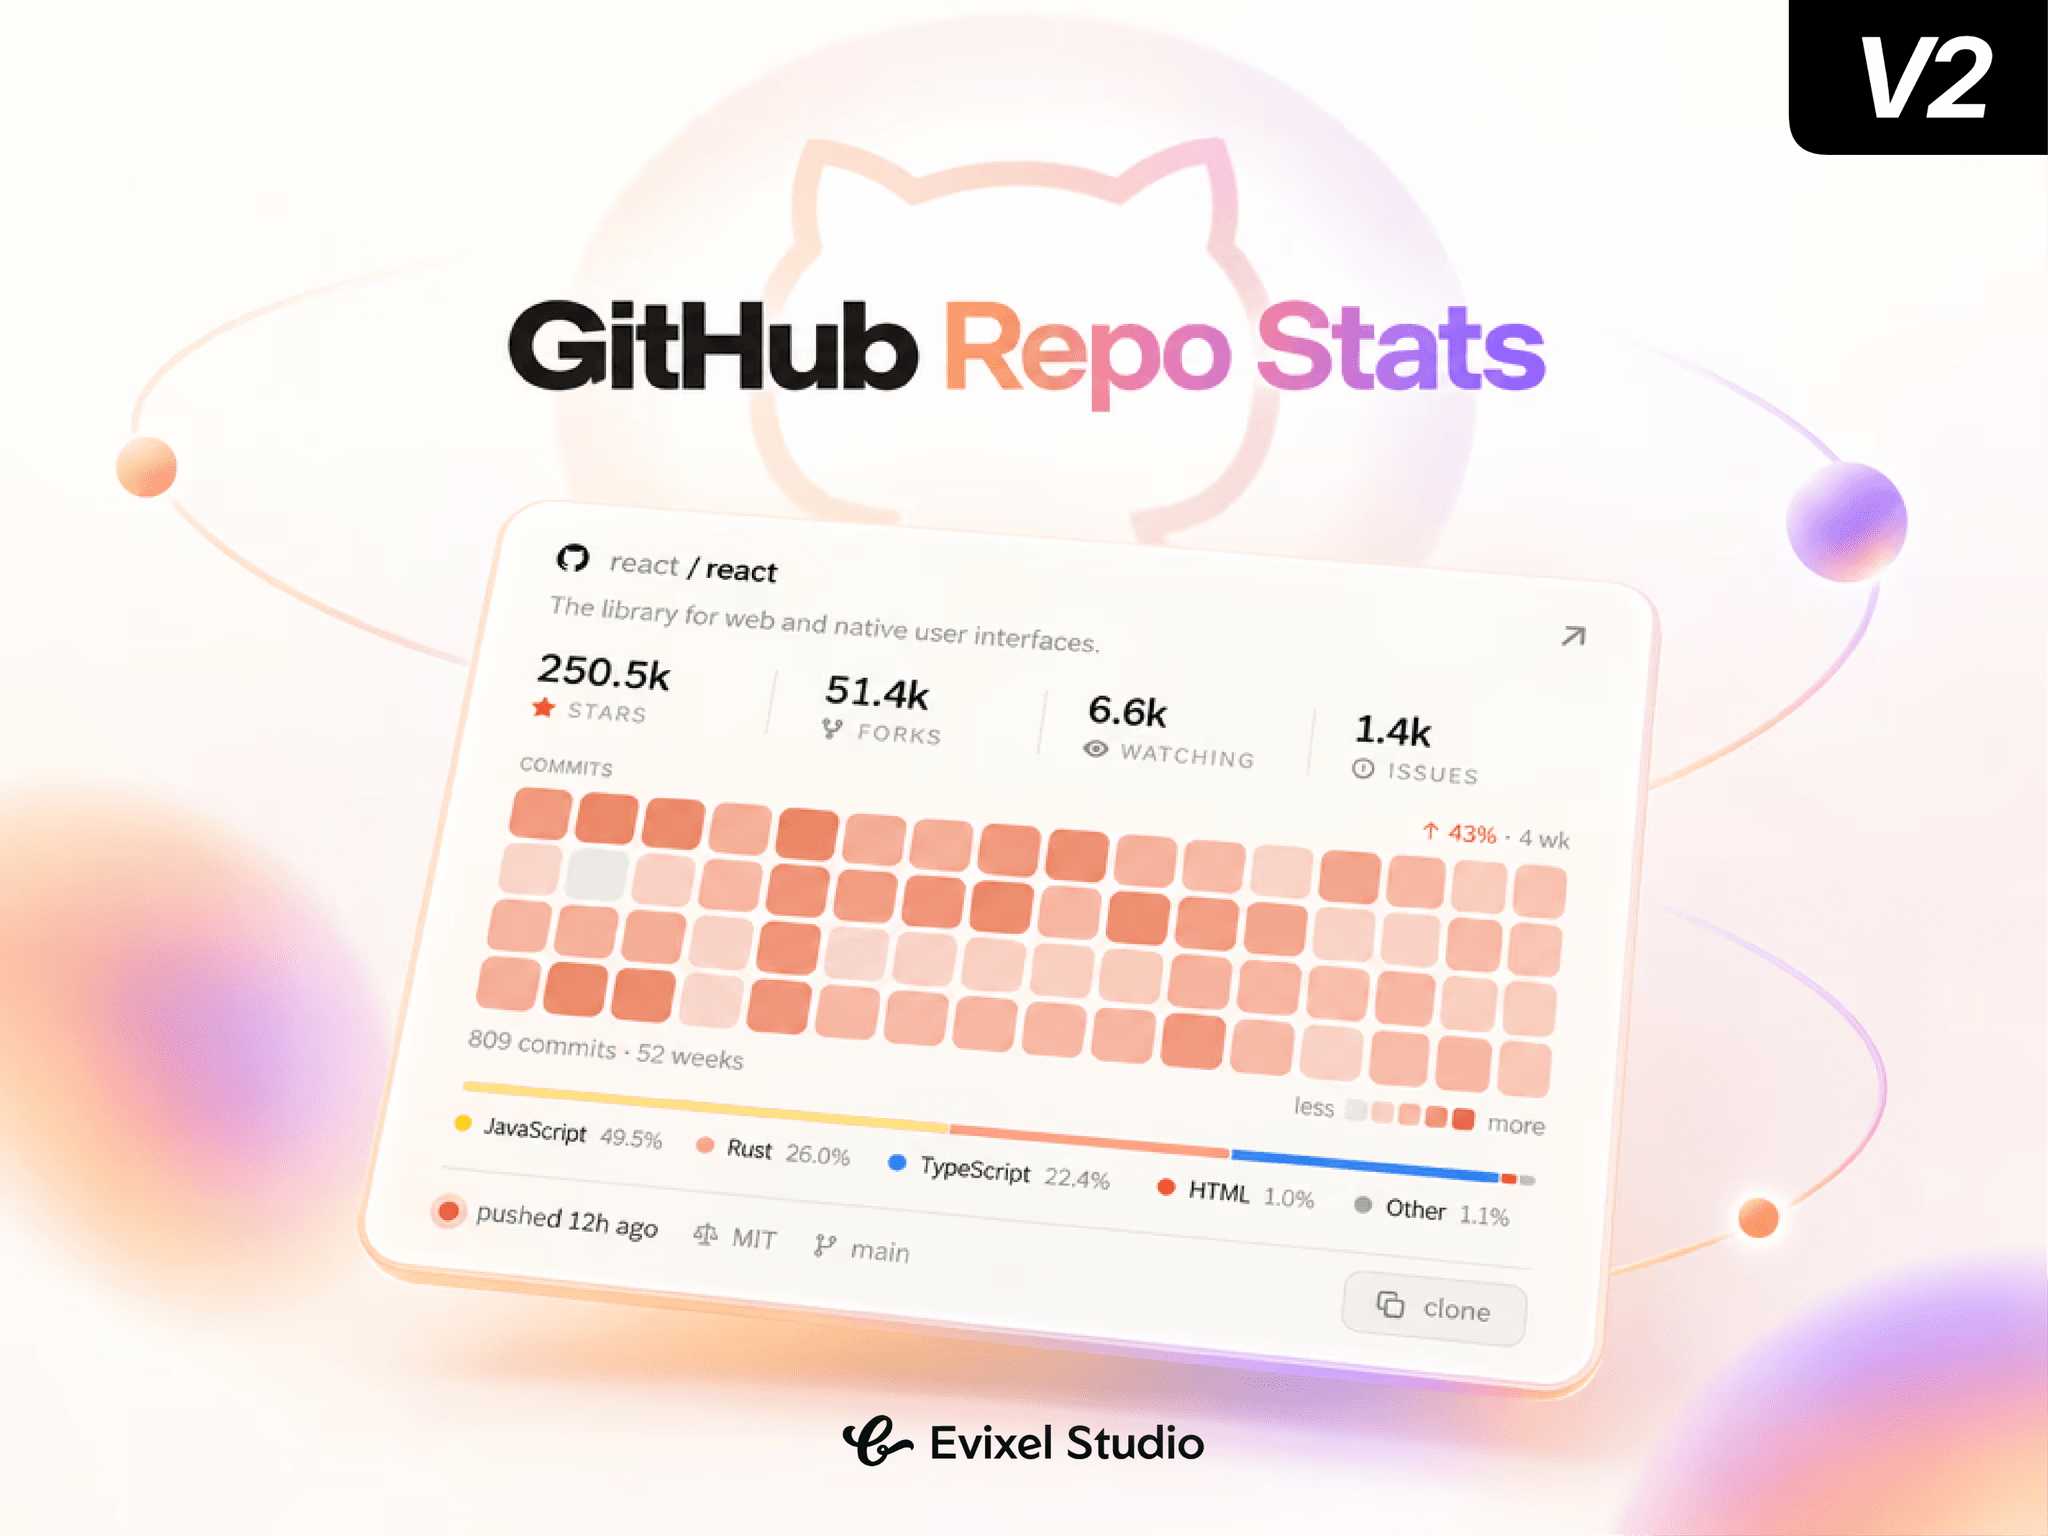
GitHub Pulse turns any GitHub repository into an editorial-grade, interactive preview card. Showcase real-time stars, forks, language breakdowns, and an interactive 52-week commit activity heatmap directly on your developer portfolio, documentation, or landing page.
Key Features
Live GitHub Stats: Real-time metrics for stars, forks, watchers, and open issues with smooth count-up numbers.
52-Week Commit Heatmap: Visual contribution matrix with hover tooltips and 4-week activity trend tracking.
Freshness Pulse: Animated status indicator showing how recently code was pushed (today, this week, or this month).
Language Breakdown Bar: Visual distribution bar displaying language percentages using official GitHub colors or monochromatic accent tints.
Card & Strip Layouts: Switch between a full-featured card and a compact, single-row horizontal strip.
One-Click Clone: Built-in copy button that instantly copies the
git clonecommand to the clipboard.Smart Rate-Limit Protection: In-memory and session caching prevent API throttling, with instant sample data on the canvas.
Property Controls
Repository: Paste any public/private GitHub URL or
owner/reposlug.Appearance: Select from curated presets (Paper, Ink, GitHub) or pick custom backgrounds, text, accents, and borders.
Layout: Switch between Card and Strip variants; configure padding, gaps, and heatmap rows (1, 2, or 4 rows).
Content Toggles: Independently show or hide descriptions, stats, commit heatmaps, language bars, and meta tags.
Motion: Customize scroll/load reveal triggers, spring physics, and count-up animations.
Advanced: Adjust cache duration or add a read-only token for private repos and higher API rate limits.
Quick Start Guide
Drag and drop GitHub Pulse onto your Framer canvas.
Enter your repository URL (e.g.,
facebook/react).Select your layout (Card or Strip) and theme preset.
Toggle on/off the specific stats you want to feature.
Publish—live GitHub data syncs automatically!