About Data Chart Pro
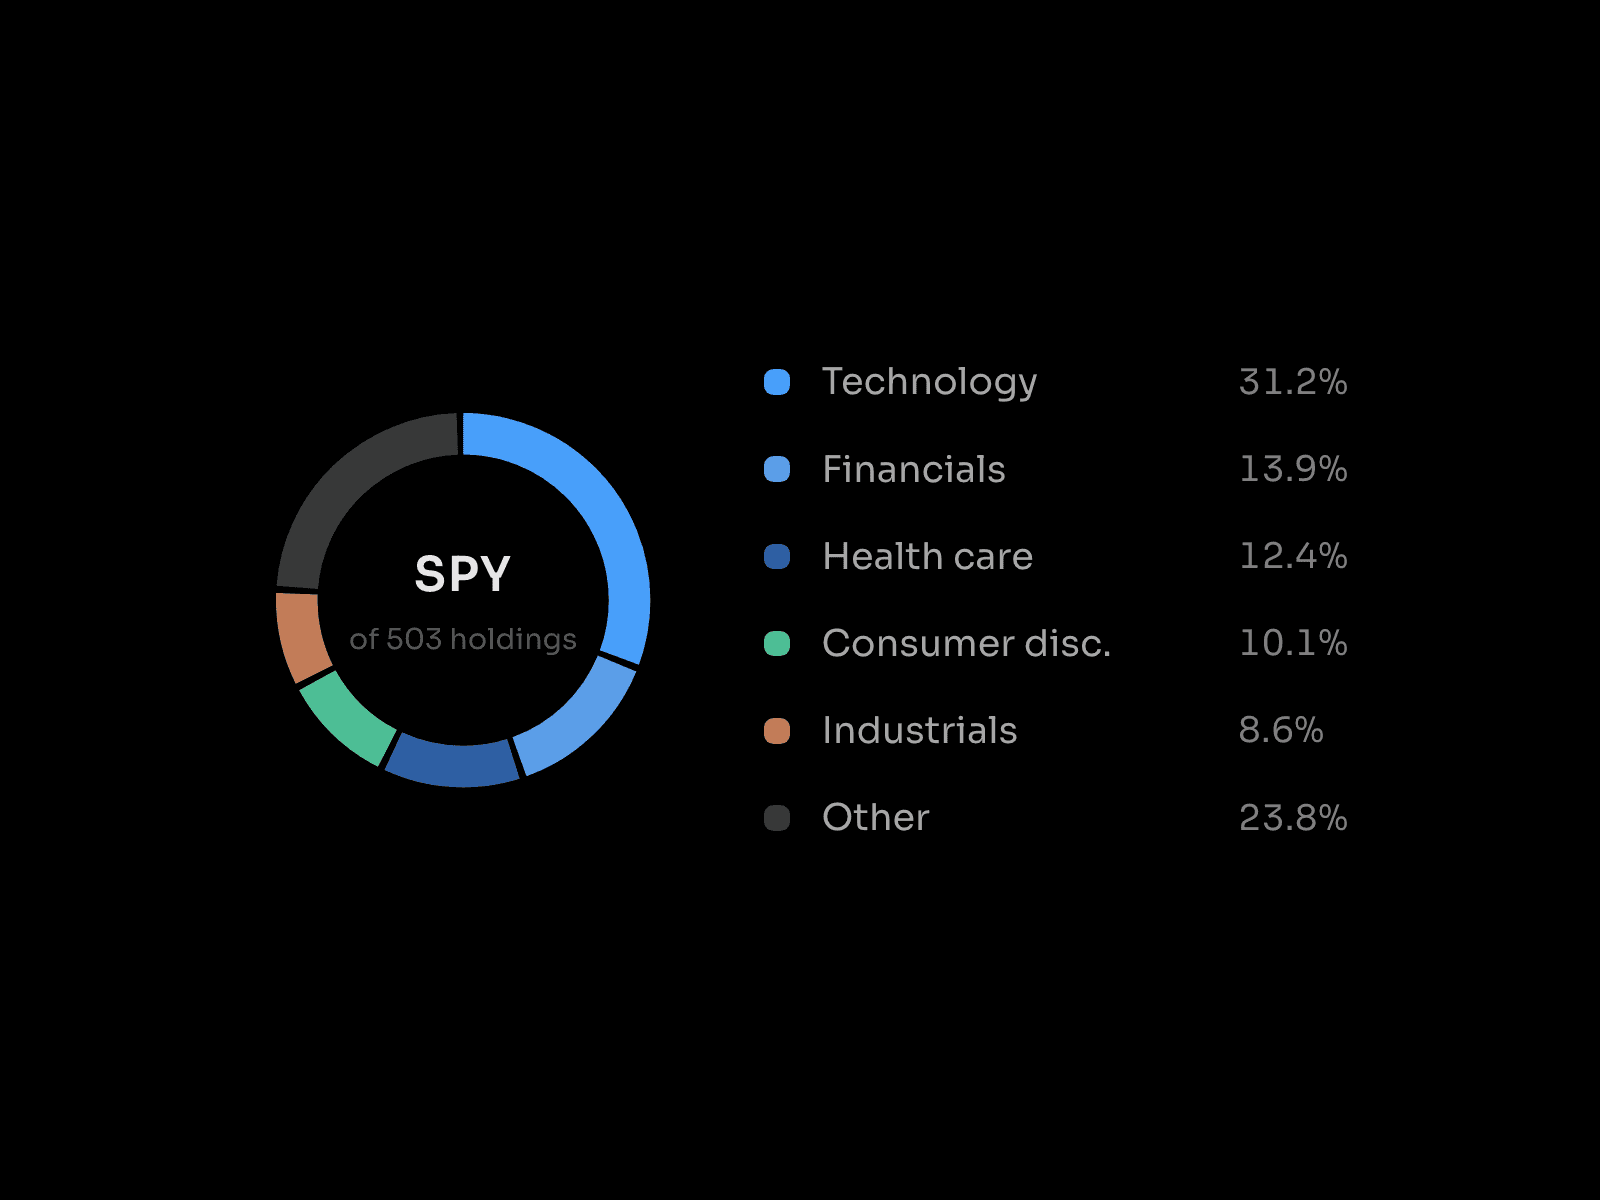
A premium data visualization component designed to turn your data into polished, interactive charts. Data Chart Pro supports Bar, Line, Pie, and Donut charts with flexible data sources and a clean, modern presentation.
Add data manually or import JSON and CSV data, then customize the chart with legends, tooltips, values, grid lines, labels, animations, and multiple visual themes. Create grouped or stacked bar charts, smooth line charts with optional area fills, and customizable pie or donut charts with centre totals and value displays.
Built for Framer, Data Chart Pro is fully responsive and highly customizable. Adjust chart styles, colors, typography, spacing, animation, frame settings, and data presentation directly through Framer Property Controls.
Features
Premium data chart component
Bar, Line, Pie, and Donut charts
Manual data input
JSON data support
CSV data support
Up to 3 data series
Grouped and stacked bars
Smooth line charts
Optional line area fills
Custom chart points
Pie and donut centre totals
Custom value formatting
Percentage and value labels
Interactive tooltips
Configurable legends
X and Y axis labels
Custom grid lines
Animated chart reveals
Multiple easing options
Paper, Graphite, Sorbet, Ink, and Signal themes
Custom color palettes
Responsive layout
Custom typography and spacing
Fully customizable with Framer Property Controls
Use Cases
SaaS dashboards
Analytics websites
Business reports
Financial dashboards
Marketing reports
Product analytics
Startup websites
Data-driven landing pages
Performance dashboards
Business presentations
Why You’ll Love It
Data Chart Pro makes it easy to present complex information in a clear and visually polished way. With multiple chart types, flexible data sources, rich styling controls, and smooth animation, you can build professional data visualizations directly in Framer.